Sunday 29 December 2013

Puppet - Bit Advanced setup and configuration

In continuation to Basic puppet setup explained in my earlier post . Here is the advanced setup.

Advanced puppet configuration:


Agenda: What exactly I am trying to replicate here.I will be trying to keep 'mod_jk.conf' file which I had placed inside '/etc/puppet/files' folder of master server to keep in sync. Whenever I make any changes to mod_jk.conf file on puppet master,the daemon running on puppet agent will pick up the changes on master and bring agent in sync with puppet master. It will also restart Apache webserver where puppet agent is installed.

----------------------------------Master side configuration changes-----------------------------------

Create  a file inside '/etc/puppet/manifests'. Touch site.pp.

site.pp
import 'classes/*.pp'
class toolbox {
        file { '/tmp/gautam.txt':
        owner => root, group => root, mode => 0755,
        content => "Hi gautam....how are you",
        }
        }
        node 'beta01.hs18.lan' {
        include toolbox
        include apache
        include mysite
        }

Create a folder 'classes' inside '/etc/puppet/manifests'. Now create two files inside classes folder.
apache.pp
mysite.pp

apache.pp
class apache {
        package { 'mod_ssl-2.2.15-29.el6.centos.x86_64':
        ensure => installed
        }

        service { 'httpd':
                        ensure => running,
                        hasstatus => true,
                        hasrestart => true,
                }
}

mysite.pp
class mysite {
                file { '/etc/httpd/conf.d/mod_jk.conf':
        owner => root, group => root, mode => 0644,
        source => "puppet:///files/mod_jk.conf",
        }

}

fileserver.conf [Please modify the content as per your requirement]
# This file consists of arbitrarily named sections/modules
# defining where files are served from and to whom

# Define a section 'files'
# Adapt the allow/deny settings to your needs. Order
# for allow/deny does not matter, allow always takes precedence
# over deny
[files]
path /etc/puppet/files/
allow *
#  allow *.hs18.lan
#  deny *.evil.example.com
#  allow 192.168.0.0/24
#
[mount_point]
        path /etc/puppet/files/
    allow *

make a folder 'files' inside '/etc/puppet' and place our file [mod_jk.conf in my case]

Now start puppet agent as explained in my previous blog ( http://kulshresht-gautam.blogspot.in/2013/12/getting-started-with-puppet-basic-setup.html ) and play around with it.

Please watch the below video for better understanding.
http://www.youtube.com/watch?v=Hiu_ui2nZa0
Getting started with Puppet - Basic setup

In this blog I will try to explain about basic setup of puppet. Assuming that you are already aware about need/benefits of puppet.

Prerequisites:

  1. Need two servers for this activity.Will make one of the server as puppet master and the other as puppet agent.
  2. The other main prerequisites for installing puppet on redhat/centos is that we need to have the following.
  • Ruby Language
  • Ruby Libraries
  • Shadow Ruby Libraries 
      [root@kulshresht1~]# yum install ruby-shadow ruby ruby-libs

In this example the name of two server is 'kulshresht1.home.lan' & 'kulshresht2.home.lan'

For understanding well:
kulshresht1.home.lan --> puppetmaster.example.org --> 10.50.20.19
kulshresht2.home.lan --> puppetagent.example.org   --> 10.50.20.30

Map the server name as 'puppetmaster.example.org' and 'puppetagent.example.org' respectively  in '/etc/hosts' file. It's better if you can get this registered in your local DNS for lookup.

Install puppet server on master server


[root@kulshresht1~]# yum install puppet puppet-server facter

puppet master server must contain the following packages:
  1. Pupppet :: contains the puppet agent
  2. Puppet-server :: contains the puppet master server
  3. facter :: contain the tool which will act as fetching information about the node

Install puppet on agent server


[root@kulshresht2~]# yum install puppet facter

For testing basic setup and get puppet working , make "Agent side configuration changes" only, as stated below, and run the below command on puppet agent server. This is basic setup of puppet.

#puppet agent --no-daemonize --onetime --verbose

Now go on puppet master screen and sign the certificate using below commands

puppet cert list
puppet cert sign "puppetagent.example.org"


Few useful commands:


puppet cert clean puppetmaster.example.org
puppet cert clean puppetagent.example.org

START PUPPET AGENT:
puppet agent --no-daemonize --onetime --verbose

TEST AGENT:
puppet agent --test

CREATE/GENERATE CERTIFICATE:
puppet certificate generate puppetagent.example.org --ca-location  remote

HOW TO SIGN CERTIFICATE:
puppet cert list
puppet cert sign "puppetagent.example.org"

----------------------------------Agent side configuration changes-------------------------------------

Add below settings in "puppet.conf" on agent side.
server= kulshresht1.home.lan / puppetmaster.example.org
puppet.conf
[main]
    # The Puppet log directory.
    # The default value is '$vardir/log'.
    logdir = /var/log/puppet

    # Where Puppet PID files are kept.
    # The default value is '$vardir/run'.
    rundir = /var/run/puppet

    # Where SSL certificates are kept.
    # The default value is '$confdir/ssl'.
    ssldir = $vardir/ssl
    server=puppetmaster.example.org

Please go through http://kulshresht-gautam.blogspot.in/2013/12/puppet-bit-advanced-setup-and.html for advance puppet setup.

Wednesday 25 December 2013

How to find out what exactly is consuming space on my hard drive

Working nowadays a lot on linux had made me extremely week in windows environment. Hahahahahaha...;)

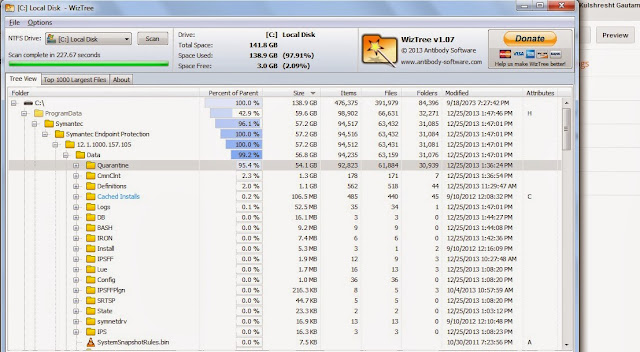
Was unable to figure out for a long time about what exactly is consuming space on my hard drive (Windows).

Googled a bit and came across a good software ( WizTree ) which resolved my issue within couple of minutes. Thought to share the same. Snapshot is attached below.

Link to download the software:

Merry Christmas and have a great day ahead. GOD bless you all.


Thursday 24 October 2013

Kryo Serialization Strategy

Kryo is a fast and efficient object graph serialization framework for Java which is much faster and efficient compared to java serialization.The project is useful any time objects need to be persisted, whether to a file, database, or over the network.Kryo can also perform automatic deep and shallow copying/cloning. This is direct copying from object to object, not object->bytes->object

In one of my previous post I had explained about how to integrate tomcat with memcache for session clustering: http://kulshresht-gautam.blogspot.in/2013/07/integrating-tomcat-with-memcahed-for.html

Now in addition to do that post here I would focus on how to override java serialization with kryo serialization which is more faster and efficient compared to the earlier one [http://code.google.com/p/thrift-protobuf-compare/wiki/Benchmarking ].The aim is still to implement memcached-session-manager but we would use kryo serialization instead of normal java serialization.

First Option :

  • As msm is available in maven central (under groupId de.javakaffee.msm) you can just pull it in using the dependency management of your build system. With maven you can use this dependency definition for the kryo-serializer:

<dependency>
    <groupId>de.javakaffee.msm</groupId>
    <artifactId>msm-kryo-serializer</artifactId>
    <version>1.6.5</version>
    <scope>runtime</scope>
</dependency>

Second Option :

  • If you're not using a dependency management based on maven repositories then below are the jars you need for kryo serializers. Please download the appropriate jars and put them in $CATALINA_HOME/lib/ .

The next task would be to add below entries in $CATALINA_HOME/conf/context.xml

<Context>

..................

        <Manager className="de.javakaffee.web.msm.MemcachedBackupSessionManager"

                 memcachedNodes="n1:hostname1:11211,n2:hostname2:11211"

                 failoverNodes="n2"

                 requestUriIgnorePattern=".*\.(ico|png|gif|jpg|css|js)$"

                 transcoderFactoryClass="de.javakaffee.web.msm.serializer.kryo.KryoTranscoderFactory"

        />

</Context>
Restart tomcat and you are done.

References:

http://code.google.com/p/kryo/
https://code.google.com/p/memcached-session-manager/

Wednesday 23 October 2013

Simple Spring Memcached [ Memcached + Spring Caching ]

Introduction

Memcached is undoubtedly one of the most popular distributed caching system used across applications. Through his post I will try to make you understand on how to integrate memcache with a Spring enabled applications. Since Spring directly supports only Ehcache therefore we will use google's SSM (Simple Spring Memcache ) to use spring caching abstraction.

Getting started

1. Dependencies - For downloading SSM dependencies add following to your POM. 
 
  com.google.code.simple-spring-memcached
  spring-cache
  3.2.0
 
 
  com.google.code.simple-spring-memcached
  spymemcached-provider
  3.2.0


2. Enable Caching – To enable caching in your spring application add following to your spring memcached.xml.
<cache:annotation-driven/>

3. Configure Spring to enable Memcached based caching  – Add following to your application memcached.xml.


           // "applicationData1" is 1st cache Name for your code


           // "applicationData2" is 2nd cache Name for your code


** Note: You have to keep on adding "applicationData1", "applicationData2" ......."applicationData.....N" if you have N number of cache name for your application. 

Limitation: You are having common key for two different value as mentioned below.

@Cacheable(value = "applicationData1", key = #EmployeeId")
@Cacheable(value = "applicationData2", key = #EmployeeId")

In above scenario two  same key are trying to put some value therefore one key will overwrite the other key value and will lead to data corruption. To avoid this we have to make our key unique. This can be achieved by adding a string in-front of the key as done below. 

@Cacheable(value = "applicationData1", key = "'applicationData1'+#EmployeeId")
@Cacheable(value = "applicationData2", key = "'applicationData2'+#EmployeeId")


If you have no constraint about overwriting cache value then there is no need for making your key unique and everything can be put in single memcache. 
As stated earlier in my different post "phpMemCachedAdmin" is a great tool to Monitor And Debug Memcached Server [ http://kulshresht-gautam.blogspot.in/2013/08/how-to-monitor-and-debug-memcached.html ]. In the snap below you can see that the key and it's corresponding size. Expiration time for these keys are infinite which is clearly visible from snapshot below.


How to install memcache : I had explained it here: http://kulshresht-gautam.blogspot.in/2013/07/memcached-installation.html


References:
https://code.google.com/p/simple-spring-memcached/wiki/Getting_Started
https://code.google.com/p/simple-spring-memcached/wiki/UserGuide#Cache_zone

Friday 20 September 2013

How to implement and use Awstats and Jawstats !!!!!! Alternative to weblog expert!!!!! Analytic tool for logs

Awstats is a free, powerful and classy tool for Logs analytics.  In this blog i would explain you on how to get started with awstats and it's full use and implementation . This is one of the most useful tool for analyzing Apache logs (but can be used to analyse any sort of logs). I will be explaining things here w.r.t Apache logs. Installing, configuring and using awstats is very easy. But problem occurs when you have distributed system and you want to bring all the logs to one location and apply the analytic on a merged log file. I had tried to explain whatever problems I faced along with solution. Hopefully you don't have to fight much after going through this blog :).

Getting started:

Install awstats on your linux box using yum commnad :
sudo yum install awstats

Vim the domain’s configuration file (located at /etc/awstats) and edit following line via text editor:
Vim awstats.xyz.com.conf

LogFile="/var/log/httpd/xyz.log"
SiteDomain="xyz.com"
HostAliases="servername (e.g: dev.home.lan)"
DirCgi="/var/www/cgi-bin"
DirIcons="../awstats/icon" 

[kulshresht@dev:/etc/awstats]$ll
-rw-r--r-- 1 root root 61936 Aug 29 13:51 awstats.xyz.com.conf
-rw-r--r-- 1 root root 61665 Feb 21  2013 awstats.localhost.localdomain.conf

-rw-r--r-- 1 root root 61665 Feb 21  2013 awstats.model.conf

/var/lib/awstats --> Database location for awstats


Merging Logs:

One of the solution for aggregating logs from different servers is to get a nfs mounted on all the production servers. Ship all the logs from individual production servers to the NFS (or any common location).

Rsync individual server's Apache logs to a common location (nfs in my case)

On server 1 : rsync -avrL /var/log/httpd/access.log /nfs/Apache_logs/access.log
On server 2 : rsync -avrL /var/log/httpd/access.log /nfs/Apache_logs/access1.log
On server 3 : rsync -avrL /var/log/httpd/access.log /nfs/Apache_logs/access2.log

Use below command to merge all the 3 log files.

sudo /usr/share/awstats/tools/logresolvemerge.pl access.log access1.log access2.log > access_final.log

More detail about  logresolvemerge.pl at below link : http://awstats.sourceforge.net/docs/awstats_tools.htm


Linux sometime doesn't understand too many parameters. So it's better we should put the commands inside shell script and give shell script path inside crontab. All cron and shell script has been mentioned below:

Cron Entries:

Crontab -e
*/5 * * * * /home/kulshresht/awstats.sh > /dev/null 2>&1
*/5 * * * * /home/kulshresht/logmerge.sh > /dev/null 2>&1
1 0 * * * /home/kulshresht/logrotate.sh > /dev/null 2>&1

Contents of all shell scripts mentioned in Cron above:

awstats.sh  [Awstats run to generate the statistic data:]
#! /bin/bash
/usr/share/awstats/wwwroot/cgi-bin/awstats.pl -config=xyz.com -update

 logmerge.sh [Merging logs]
#! /bin/bash
set -x
cd /nfs/Apache_logs
/usr/share/awstats/tools/logresolvemerge.pl access.log access1.log access2.log > access_final.log
echo "The files have been Merged successfully"

logrotate.sh [Log rotation and deleting old logs at 12 AM midnight ]
#! /bin/bash
cd /nfs/Apache_logs
rm -rf *
touch access1.log access2.log access.log access_final.log
chmod a+rwx *
echo "Merged"


Remeber to change the permission of scripts:

-rwxrwxrwx 1 kulshresht kulshresht        90 Aug 29 17:28 awstats.sh
-rwxrwxrwx 1 kulshresht kulshresht       175 Aug 29 17:27 logmerge.sh
-rwxrwxrwx 1 kulshresht kulshresht        90 Aug 29 17:28 logrotate.sh

You are done and awstats is ready for use. 

Use below link (IP address of the server on which awstats is installed) to access the awstats UI.
http://115.11.82.11/awstats/awstats.pl?config=xyz.com


For hourly basis stats: http://115.11.82.11/awstats/awstats.pl?month=11&year=2013&output=main&config=homeshop18.com&framename=index&databasebreak=hour&day=19&hour=11


You can have better view through jawstats (built on top of awstats). Snapshot below:


Reference:
http://blog.secaserver.com/2011/12/linux-install-jawstats-beautiful-statistic-awstats-core/
http://awstats.sourceforge.net/docs/awstats_setup.html
http://awstats.sourceforge.net/
http://awstats.sourceforge.net/docs/awstats_faq.html#DAILY
http://ebasso.net/wiki/index.php/AWSTATS:_Configurando_o_AWSTATS

Wednesday 4 September 2013

Best Google Chrome Extensions - You should try them at least once


1. Google Drive

Create, share and keep all your stuff in one place. Mine favourite one :). Best way to keep backup of your important stuffs/documents

2. Adblock

The most popular Chrome extension, with over 15 million users! Blocks ads all over the web

3. Sketchboard.Me

Realtime sketchboard for technical teams. Sketch UML, free hand and mind maps.

4. Turn-off-the-lights

Perfect for watching an online video with the Turn Off the Lights Chrome extension. 

5. Pocket

Pocket Website - The best way to save-for-later articles, videos and more. Alternative to bookmark and accessed across all platforms.

6. Ghostery

Protect your privacy. See who's tracking your web browsing with Ghostery.

7. History Eraser

Deletes typed URLs, Cache, Cookies, your Download and Browsing History...instantly, with just 1-click on the Eraser button!

8. PasswordBox

Never Forget A Password Again! Tired of remembering passwords? SAVE TIME WITH 1-CLICK LOGIN! 

9. Prezi

Prezi is a zooming web-based presentation tool that moves beyond the constraints of traditional slides.

10. Sticky Notes

Create and share notes online you can access anywhere. Dead simple. Totally free!


Source:

Friday 23 August 2013

How to use Apache as Software Load Balancer [ mod_jk implementation of Apache ]

Using Apache as Software Load Balancer


Here, I will be explaining on how 'mod_jk + Apache' can be used together to work as a software Load Balancer.

Note: I am assuming that whoever is reading this has basic knowledge of Apache and its use and implementation.

There are mainly three files which you can put inside conf.d folder lying inside Apache main configuration (/etc/httpd/conf.d).
  1. mod_jk.conf
  2. ssl.conf [For https content]
  3. workers.properties
I am excluding "httpd.conf " file here. You can leave it with original settings . I am also excluding "uriworkermap.properties" file because instead of defining the context path or the name of your war file here, you can simply run you application as ROOT.war. Meaning, rename your "xyz.war" to "ROOT.war" and run your tomcat server. After renaming your application as ROOT.war ,you don't have to write the context path while accessing your application. And you have excluded one file ("uriworkermap.properties") while setting up Apache as Software Load Balancer. Isn't this a good deal :).

E.g:

How to access your application if the name of your war file is:

xyz.war --> http://localhost:8080/xyz
ROOT.war --> http://localhost:8080  [No need to explicitly mention the context path ; port 8080 is the port on which your tomcat server is running]

Anyhow , I will write down the settings of "uriworkermap.properties" too, incase anybody still needs that.

# worker configuration file
# Mount the Servlet context to the ajp13 worker
/xyz/=loadbalancer
/xyz/*=loadbalancer

Below are the content of the 3 files mentioned above which should be used for setting up Apache to make it work as Software Load Balancer.

1) mod_jk.conf

# Load mod_jk module
LoadModule jk_module modules/mod_jk.so

#It's better to define Listen port and comment out that in httpd.conf file
Listen 80  
<VirtualHost *:80>
#ServerName 10.34.24.54
DocumentRoot /var/www/html

RewriteEngine On
RewriteLogLevel 1
RewriteLog logs/rewrite.log
  
JkMount /jkmanager/* jkstatus
JkMount /* loadbalancer
JkUnMount /siteimages/* loadbalancer # Static images served from here
JkUnMount /robots.txt loadbalancer
</VirtualHost>

# Where to find workers.properties
JkWorkersFile conf.d/workers.properties
# Where to put jk logs
JkLogFile logs/mod_jk.log
# Set the jk log level [debug/error/info]
JkLogLevel info
# Select the log format
JkLogStampFormat  "[%a %b %d %H: %M: %S %Y]"
# JkOptions indicates to send SSK KEY SIZE
JkOptions +ForwardKeySize -ForwardDirectories
# JkRequestLogFormat
JkRequestLogFormat "%w %V %T"
# Mount your applications
#JkMount /* loadbalancer
# You can use external file for mount points.
# It will be checked for updates each 60 seconds.
# The format of the file is: /url=worker
# /examples/*=loadbalancer
#JkMountFile conf.d/uriworkermap.properties
# Add shared memory.
# This directive is present with 1.2.10 and
# later versions of mod_jk, and is needed for
# for load balancing to work properly
JkShmFile logs/jk.shm
# Add jkstatus for managing runtime data

#Add the jkstatus mount point

# Add jkstatus for managing runtime data
#<Location /jkstatus/>
#    JkMount status
#    JkUnMount status
#    Order deny,allow
#    Allow from all
#</Location>

# Add the jkstatus mount point
#JkMount /jkmanager/* jkstatus
#Enable the JK manager access from localhost only
<Location /jkmanager/>
  JkMount jkstatus
  Order deny,allow
  Allow from all
</Location>

<IfModule mod_expires.c>
        <FilesMatch "\.(ico|pdf|flv|jpe?g|png|gif|js|css)$">
                ExpiresActive On
                ExpiresDefault "access plus 2 year"
        </FilesMatch>
</IfModule>

#SetEnvIf Request_URI "^/check.txt$" dontlog
SetEnvIf Request_URI "(\.gif$|\.jpg$|\.JPG$|\.Jpg$|\.png$|\.js$|\.css$|\.woff$|\.ttf$|\.eot$|\.ico$|server-status$|jkmanager)" dontlog

LogFormat "@%{X-Forwarded-For}i@ %h %l %u %t %T \"%r\" %>s %b %T \"%{Referer}i\" \"%{User-Agent}i\" \"%{JSESSIONID}C\" \"%{HS_ID}C\" " custom

CustomLog "|/usr/local/sbin/cronolog  -S /var/log/httpd/access.log  --period='1 days' /var/log/httpd/access.%Y%m%d.log" custom   env=!dontlog


2) ssl.conf


Not going to explain this in detail. Just take care of your certificates path. Get a self signed certificate if you are setting this up in dev/preprod environment.

And don't forget to add this line in this file too.
JkMount /* loadbalancer


3 ) workers.properties


# Define list of workers that will be used for mapping requests

worker.list=loadbalancer,jkstatus

# Define the first member worker
worker.jvmnode1.port=8010                     
#8010 is the ajp port and not http port
worker.jvmnode1.host=10.34.24.54
worker.jvmnode1.type=ajp13
worker.jvmnode1.lbfactor=1            
#LBFactor is very crucial parameter. It decides load distribution. In this scenario it's 50:50


# Define the second member worker
worker.jvmnode2.port=8010              
worker.jvmnode2.host=10.34.24.55
worker.jvmnode2.type=ajp13
worker.jvmnode2.lbfactor=1


worker.loadbalancer.type=lb
worker.loadbalancer.balance_workers=jvmnode1, jvmnode2

worker.loadbalancer.sticky_session=1
worker.jkstatus.type=status


Software Vs Hardware Load Balancer ?


Load balancing your application is crucial piece of your whole architecture. Load balancer plays an important role to maintain application & network performance; it helps in dynamic load balancing which is very important for ensuring that our requests and resources are evenly distributed across available servers and in an optimal manner.

The basic question which haunts us frequently is ...........How to decide that we should use hardware load balancer or software load balancer and on what criteria the decision should be taken?

This question in itself is very complicated and the answer would differ from person to person and upon requirement. There is no end to any technical argument if you don't have any data to validate about what you are suggesting / interpreting ;). So, whatever I will be proposing in this blog is my personal view and I leave it up to you to agree/disagree.

We should be cognizant about our exact requirement (never do over engineering) and henceforth use your technical skills and experience in appropriate direction to get the utmost out of it. If you are a novice to Load balancer and its use/implementation then hopefully this would be a good place to kick start. You can drop me a mail if you have any doubts regarding below explanation, will try my best to clarify your doubts.

Now coming back to original question………….How to make a decision on whether we should go ahead with HLB or SLB (Hardware Load Balancer or Software Load Balancer)? 

The obvious difference is that one is software and so needs to be installed on a server. That server can be of any configuration and therefore could be fast or slow, reliable or not etc etc (Totally depends on server configuration such has Ram size, CPU cores etc etc…Google it  know more). A hardware load balancer is a dedicated piece of hardware that you would install in your server rack.

The question comes down to your budget, experience and the importance of your product. If you have the money to spend, dedicated load balancers are the easy and safe way to go. But in a pinch, a dedicated server running load balancing software should be fine if you're able to configure it (depending on the hardware and traffic demands). Some of the things which should be kept in mind before taking any decision is mentioned below:
 
  1. Concurrent requests on your site.
  2. HA is required for your site or not (HA -> High availability)
  3. Performance/speed (HLB definitely enhance the performance of the site in many ways)
  4. Costs
  5. Downtime (Can you afford this?)
  6. In-house skill sets to setup and troubleshoot issues if you are setting up SLB yourself.
  7. Scalability (The most important parameter, IMO)

To terminate SSL most of the companies run SSL connections into Linux boxes running Apache. This setup is convenient and easy to setup but it's not optimized for SSL, so it's slow and costly operation. Much of the capacities of these servers are unnecessarily consumed processing SSL. Load balancers on the other hand have crypto cards that terminate SSL very efficiently in hardware. Getting rid of the Linux boxes and moving SSL to HLB will decrease load on Apache and eventually lower the number of request being processed by Apache which would eventually enhance Apache performance and a whole lot of CPU can easily be reclaimed. Client performance will also be greatly increased because SSL accelerators are faster at SSL than generic LINUX boxes. Though you can argue that Nginx can be used for the SSL and rest of the operations could be left with Apache, but again Nginx needs a dedicated Linux box to be set up.

SLB is a single point of failure. We can use Haproxy in front of apache. Haproxy and Apache both can act as SLB but Haproxy is more robust than Apache and is a reliable, High performance TCP/HTTP Load Balancer. It will not make you let you down. And the most important thing is it's open source or to be more specific it's FREE!!!!!FREE!!!!!FREE!!!!!!!.........And you know FREE is always better and give eternal happiness to us :) . Moreover you don't have to depend on 3rd Party for making any changes at LB level. Generally LB are maintained by third party or sysadmin and you will have limited or no access to it. So better go for Haproxy as Load balancer and Nginx for the serving https requests.

But as you organization grows bigger and bigger than you have to go for some robust and scalable architecture. Scalability is the biggest factor for any growing organization.HLB are dedicated LB and they were meant for some purpose and not merely for earning money by big fish like Cisco. A normal person can't even think to buy Cisco/F5/F20 load balancer because they are so costly. Definitely there are open source LB available but it doesn't solve your purpose solely ..........To explain in simple words ......You can cook doesn't mean you are a chef ;).So definitely hardware has its own 1001 advantages but you should know when to go for it ;until and unless you have enough money in pocket to shed off ;) . To be very practical, here the debate isn't really on "HLB" vs "SLB". It is on "buy a proven/tested/certified technology stack as an appliance” versus “builds it yourself using open source". 

I had tried my best not be biased and had given an overview about SLB as well as HLB. Now, the call is completely yours. 

My personal point of view:

Having a bit of knowledge about performance engineering (I am aware that HLB will definitely boost performance of application ;) ) ,being a bit of developer, a bit knowledge of Sysadmin , a bit knowledge of supporting & troubleshooting production issues, and doing production deployment frequently .......I would give my vote to Software Load Balancer. It’s a onetime pain to establish everything initially but once set up fully you would be the undisputed owner of it and can play around with it. Things are always easy if you are controlling it. Believe me, telling my personal experience, it's a pain in a** to go to sysadmin and request changes at LB level. These devices (HLB) are out of your control and are difficult to debug, provision, and test. So my vote goes to Software Load Balancer (SLB) and to be more specific HAProxy.

Had tried to cover up on how to use Apache as Software Load Balancer (using mod_jk configuration). Check this out: http://kulshresht-gautam.blogspot.in/2013/08/how-to-use-apache-as-software-load.html


Abbreviation used in this Blog : 

Load Balancer: LB
Hardware Load Balancer: HLB
Software Load Balancer : SLB

Wednesday 7 August 2013

How to Monitor And Debug Memcached Server Using phpMemCachedAdmin


Download phpMemCachedAdmin tarball


#wget http://phpmemcacheadmin.googlecode.com/files/phpMemcachedAdmin-1.2.2-r262.tar.gz


Install phpMemCachedAdmin in `/var/www/html/memcached/` directory, create a folder memcached inside /var/ww/html/. Extract phpMemCachedAdmin.tar.gz and change permission for Memcache.php

# mkdir -p /var/www/html/memcached
# tar -xvzf phpMemcachedAdmin-1.2.2-r262.tar.gz -C /var/www/html/memcached/
# chmod a+rwx /var/www/html/memcached/Config/Memcache.php

Apache Configuration

Create a file "memcached.conf" inside /etc/httpd/conf.d and add below configuration in that file.

# cd /etc/httpd/conf.d
# vim memcached.conf

Add below configuration in memcached.conf

Listen 85
<VirtualHost *:85>
    ServerName   10.23.11.11
    UseCanonicalName Off
    ServerAdmin  "kulshresht@xyz.com"
    DocumentRoot "/var/www/html/memcached"
    CustomLog  /var/log/httpd/memcached-access_log common
    ErrorLog   /var/log/httpd/memcached-error_log
</VirtualHost>

P.S: You can use any port for phpAdmin , whichever is free for you. In mine case 80 and 81 were already used , therefore i had used 85.

Restart Apache: /etc/init.d/httpd restart
P.S: Do not forget to install php to see the UI interface -> [ sudo yum install php ]

Few snapshots are attached below for reference:


If you want to explore further on Memcache installation steps then go to below link:
http://kulshresht-gautam.blogspot.in/2013/07/memcached-installation.html


Thursday 1 August 2013

Shell script to find total request vs error count in Apache logs

Tweak the below script to suit your log format .

#!/bin/sh
echo "" > /tmp/error.csv

outFile="/tmp/Error.txt"
outFile1="/tmp/Error_Count.txt"
outFile2="/tmp/Total.txt"
outFile3="/tmp/Total_Request.txt"

a=`cat /var/log/access.log|awk '{print $10}' | wc -l`
cat /var/log/access.log|awk '{print $4":"$10}' | awk -F':' '{print $2}' | sort | uniq -c > $outFile2

cat $outFile2 | awk '{for(i=1;i<NF;i++){ print $2 "  " $i*3}}' > $outFile3

b=`cat /var/log/access.log|awk '{print $10}' | grep "^5" | wc -l`
cat /var/log/access.log| awk '{print $4":"$10}' | awk -F':' '{if($NF>=500){print $2}}' | sort | uniq -c > $outFile

cat $outFile | awk '{for(i=1;i<NF;i++){ print $2 "  " $i*3}}' > $outFile1

mailsend -smtp mailserver.production.xyz.lan -port 25 -M "Total request count/Error count for `date +%m:%d:%Y` : $(expr $a \* 3) / $(expr $b \* 3) " -t kulshresht.gautam@xyz.com -f kulshresht.gautam@xyz.com -sub "Request / Error count" -attach $outFile1,text,a -attach $outFile3,text,a

Log format Sample:

1.2.3.4 - - [31/Jul/2013:00:00:00 +0530] 0 "GET  HTTP/1.1" 200 20 0 "http://www.xyz.com/adsjskds" "Mozilla/4.0 (compatible; MSIE 8.0; Windows NT 5.1; Trident/4.0; InfoPath.2)" "8D8E535ED8CBE15ED60C365.jvmnode1"


**Mailsend should be configured on your system.

**I am mutlipying the output by 3 because we have 3 apache web servers , and all 3 are under one Load Balancer.

Monday 22 July 2013

Understanding Java Heap Space

Heap|Xms|Xmx|Jconsole|Heap Space|Java Heap Space
Before going in depth , let us first understand the basics of heap and stack....

Heap - what exactly is this?

  1. Class instances and arrays are stored in heap memory. Heap memory is also called as shared memory. As this is the place where multiple threads will share the same data .Instance variables and the Objects lie on Heap.
  2. The heap is memory set aside for dynamic allocation. Unlike the stack, there's no enforced pattern to the allocation and deallocation of blocks from the heap, you can allocate/deallocate a block at any given time.
  3. This includes the Objects created in local scope of any methods. In this case, reference variables to local objects are stored with method frame in a stack, but actual object lies in heap.
  4. The heap is typically allocated at application startup by the runtime, and is reclaimed when the application (technically process) exits.

Stack - what exactly is this?
  1. Local variables and methods lie on the Stack.
  2. Java stacks (Sometimes referred as frames) are created private to a thread. Every thread will have a program counter (PC) and a java stack. PC will use the java stack to store the intermediate values, dynamic linking, return values for methods and dispatch exceptions. Every thread, including the main thread, daemons threads - get their own stack.
  3. When a thread invokes a method, the JVM pushes a new frame onto that thread's Java stack.
  4. All method calls, arguments, local variables, reference variables, intermediate computations and return values if any are kept in these stack corresponding to the method invoked.
  5. The memory allocated for frame does not need to be contiguous.
  6. The stack is always reserved in a LIFO order; the most recently reserved block is always the next block to be freed.
  7. The stack is attached to a thread, so when the thread exits the stack is reclaimed.

Gist:
  1. Local Variables are stored in stack during runtime.
  2. Static Variables are stored in Method Area.
  3. Arrays are stored in heap memory.
  4. Stack does not need to be contiguous.
  5. The stack is faster because the access pattern makes it trivial to allocate and deallocate memory from it (a pointer/integer is simply incremented or decremented), while the heap has much more complex bookkeeping involved in an allocation or free. Also, each byte in the stack tends to be reused very frequently which means it tends to be mapped to the processor's cache, making it very fast.


Heap Regions


[ Offline comment --> Used "sketchboard.me" provided by chrome store to make above snap. Cool stuff from Google. Try that out too :) ]


  1. Eden Space (heap): pool from which memory is initially allocated for most objects.
  2. Survivor Space (heap): pool containing objects that have survived GC of eden space.
  3. Tenured Generation (heap): pool containing objects that have existed for some time in the survivor space.
  4. Permanent Generation (non-heap): holds all the reflective data of the virtual machine itself, stores class level details, loading and unloading classes (e.g. JSPs), methods, String pool. PermGen contains meta-data of the classes and the objects i.e. pointers into the rest of the heap where the objects are allocated. The PermGen also contains Class-loaders which have to be manually destroyed at the end of their use else they stay in memory and also keep holding references to their objects on the heap.
  5. Code Cache (non-heap): HotSpot JVM also includes a "code cache" containing     memory used for compilation and storage of native code.

Understanding Heap allocation and Garbage Collection


Garbage collection (GC) is how the JVM frees memory occupied by objects that are no longer referenced. Garbage collection is the process of releasing memory used by the dead objects. The algorithms and parameters used by GC can have dramatic effects on performance.

The Java HotSpot VM defines two generations: the young generation (sometimes called 
the "nursery") and the old generation. The young generation consists of an "Eden space"
and two "survivor spaces." The VM initially assigns all objects to the Eden space, and
most objects die there. When it performs a minor GC, the VM moves any remaining
objects from the Eden space to one of the survivor spaces. The VM moves objects that 
live long enough in the survivor spaces to the "tenured" space in the old generation. When
the tenured generation fills up, there is a full GC that is often much slower because it
involves all live objects. The permanent generation holds all the reflective data of the
virtual machine itself, such as class and method objects.


Figure: Generations of Data in Garbage Collection


Points to remember (Tips which can be very useful for tuning Heap):


Garbage collection can become a bottleneck in highly parallel systems.  By understanding how GC works, it is possible to use a variety of command line options to minimize that impact. Java heap allocation starts with min size -Xms and increases upto Xmx. At any point, it has used heap(heap actually in use), committed heap (allocated heap at that point. includes used + free), max heap(max heap that can be allocated).Try to keep -Xms and -Xmx same to reduce frequent Full GC.

The bigger the young generation, the less often minor collections occur. However, for a bounded heap size a larger young generation implies a smaller old generation, which will increase the frequency of major collections (full GC's)


-XX:NewRatio=3 means that the ratio between the young and old generation is 1:3; in other words, the combined size of eden and the survivor spaces will be one fourth of the heap.


Recommended JVM parameters (Can differ from application to application. Study more and get the best tuning for your application)


export CATALINA_OPTS="-Xmx4096m –Xms4096m -Xmn1g -XX:ParallelGCThreads=
16 -XX:+UseConcMarkSweepGC -XX:+UseParNewGC -XX:SurvivorRatio=8
 -XX:TargetSurvivorRatio=80 -XX:PermSize=512M -XX:MaxPermSize=1024M"
  1. Add -Xmn1g parameter [To mainly take care of young generation objects]
  2. Add  -XX:ParallelGCThreads=16  [Formula for this: We get 1 parallel GC thread per CPU for up to 8 CPUs, and 5/8 after that (so for 16 CPUs we get: 8 + 5/8 x 8 = 13
  3.  GC threads).]
  4. Add -XX:SurvivorRatio=8 
  5. Add -XX:TargetSurvivorRatio=80
  6. -XX:NewRatio=3
  7. Try to keep -Xms and -Xmx same to reduce frequent Full GC.
  8. Always use CATALINA_OPTS if if you're setting environment variables for used only by Tomcat, you'll be best advised to use CATALINA_OPTS, whereas if you're setting environment variables to be used by other java applications as well, such as by JBoss, you should put your settings in JAVA_OPTS. http://stackoverflow.com/questions/11222365/catalina-opts-vs-java-opts-what-is-the-difference


Use Jconsole to capture the clearest picture of how the different generations of memory are behaving for your application .Below is a good example of how to enable JMX port for monitoring your application using Jconsole/JvisualVM.

e.g: 

##### JConsloe options added by Kulshresht to analyse heap memory  ----------

CATALINA_OPTS="$CATALINA_OPTS  \
                               -Dcom.sun.management.jmxremote \
                               -Dcom.sun.management.jmxremote.port=15556 \
                               -Dcom.sun.management.jmxremote.ssl=false \
                               -Dcom.sun.management.jmxremote.authenticate=false\
                               -Djava.rmi.server.hostname=19.83.73.82"

Jconsole & JvisualVM are inbuilt JDK tools. So there is no extra tension of installing other softwares (assuming you already have JDK installed :)). JvisualVM has great graphics. The only disadvantage with these tools is that they do not save historical data. So, if something goes wrong with your application at midnight then you can't trouble shoot the issue withe these graphs until and unless you have enabled the Jconsole UI (24*7) on a particular machine. Don't get disheartened , there is always a way :). The tool which can be used to store historical data is "Hyperic".